Four NEE Data Tool Features to Help You Get the Most out of Your Evaluation Data
Compiling teacher evaluation data in an online teacher evaluation system saves administrators time and eliminates stress.
If you’re still tracking evaluation data by hand or fumbling through a home-grown system that isn’t providing you with meaningful data, it’s time to consider an option that will make your job so much easier by eliminating the busywork and providing better data.
The NEE Data Tool is one option – and it’s affordable to boot. We can help you transform your evaluation process from one based on compliance to one based on educator growth.
Read on to learn how the online NEE Data Tool can help you improve, simplify, and streamline your evaluation processes.
The NEE Data Tool Overview
The NEE Data Tool provides administrators with an online system for tracking and recording observations; incorporating additional evaluation measures (if you choose) such as PD plans, unit of instruction plans, and student surveys; and linking to professional development resources in the EdHub Library. It’s a platform based on a growth system to coach and support teachers throughout their development.
Now, on to some of the specific features.
Feature 1: Classroom Observations
Classroom observation forms and reports are some of the NEE Data Tool’s basic functions to help administrators simplify their evaluation processes.
With the NEE Data Tool, you can launch a classroom observation on the go on any device. So, if you’re walking around the building and heading into a classroom, open up a new observation right from the web app. Select the teacher, and away you go.
Then you’ll see the Classroom Observation Report. On the image below, we’ve highlighted a few important features:
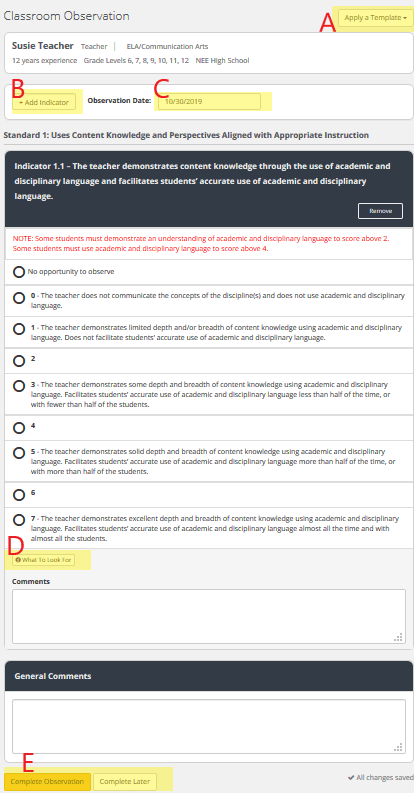
(A) Apply a Template
When you launch a classroom observation, you can apply a template to automatically populate your observation form. Many times, someone at the district level will create a “default” template that includes the focus areas for your district, and that is the template you will use for observing most teachers. (For simplicity, the sample above includes only one teaching indicator, but a normal classroom observation in the NEE system would include three to five indicators, determined by your district.)
You might choose to create additional templates that you use at your building level or for specific sets of teachers. For instance, you might select an additional indicator or two to measure for beginning teachers only. You would create a template that you use for beginning teachers and then select that template as you’re entering a beginning teacher’s classroom. (Note that any template you create will be visible to all evaluators in your building, and if you have district-level access in the system, your templates will be visible to other evaluators in the district. So you want to be strategic about the templates you create. Only the person who creates the template can delete it.)
(B) Add Indicator
Even after applying a template to your observation, you can add other indicators.
If a teacher is struggling with a specific strategy that is not included in the indicators your district or building has chosen to measure, you might select “add indicator” for that teacher during your observation. There are 27 observable indicators in the NEE system to choose from. Adding an indicator to your observation allows you to document issues and to start a conversation around a personalized professional growth plan for that teacher.
(C) Observation Date
The observation date field will automatically populate with the day’s date that you opened the observation. You are able to change it if you need to.
(D) What to Look For
Through the NEE system, you will receive annual training on observation of teachers and what to look for when scoring certain indicators in the classroom. Training increases the accuracy and reliability of your classroom observation scores. If you need a reminder for what to look for to help you score a certain indicator, select this button to see examples of evidence for each score.
(E) Completing the Observation
You may choose to complete the observation as you’re leaving the classroom, or you can save it for later. Completing the observation (gold button) will immediately inform the teacher (through email) that data is available for them to view, and they can then log in to see your scores and feedback. Some evaluators wait to complete the observation later if they want to expand on their comments or get clarification from the teacher about what was observed before finalizing their scores. In that case, click “Complete Later” (white button) and come back to it at another time.
Incomplete observations will show up on the Dashboard you first see when you log in to the NEE Data Tool. You can also view incomplete observations on the “My Teachers” menu. Under “Scoring,” select “Score Classroom Observations.”
It is possible to edit classroom observation scores and comments after the observation has been completed. From the “My Teachers” menu, select “Classroom Observation Reports,” click on the completed observation, and click edit next to the score under the chart. (You cannot edit scores and comments entered by another evaluator.)
Feature 2: The Indicator Trend Report
The indicator trend report is one of the NEE Data Tool’s most popular reports. With this report, you see the teaching indicators that are being measured in your building or district and the performance over time. You can look at the data in an aggregated way to see trends across your district and building, or you can drill down to a specific evaluator and teacher to see individual trends over time.
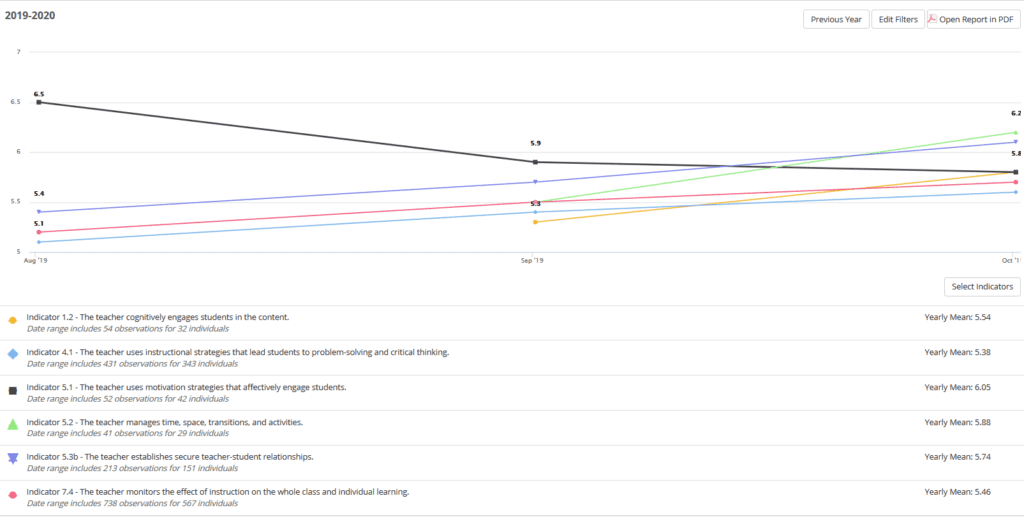
A district-wide report, above, shows the performance over time on six of the NEE indicators that have been evaluated in this district. In the details below the graph, you see how many evaluations are included in the data set for each indicator and the yearly mean for each indicator.
Some buildings show this report (in the aggregated form) at every staff meeting for the entire faculty to consider and discuss. If certain indicators are trending downward, it might be time to consider faculty-wide professional development activities around that indicator. If an indicator is consistently near the top of the scale, your school might be ready to introduce a new indicator to focus on instead.
You can customize this report to look at only one or two indicators at a time, and you can also look back at previous years of data. The report can be exported in Excel and PDF.
This is a powerful report for spotting trends in order to make decisions about focus areas and potential PD offerings for your whole staff and for individuals.
Feature 3: The Summative Status Report
Spring is a busy time for school leaders! One of the tasks that can take up a good chunk of time in the spring is teacher summative evaluations. With the NEE Data Tool, data from your classroom observations and other measures over the course of the evaluation cycle feed right into the summative report. So when you’re ready for the summative evaluation, just open the summative report for each teacher, add your comments, make your recommendations, and voila!
Keeping track of summative reports manually can be a tedious process. The summative status report is like a progress report for the summative process. It helps you keep track of all the steps for your entire staff and make sure you don’t miss anything (or anyone).
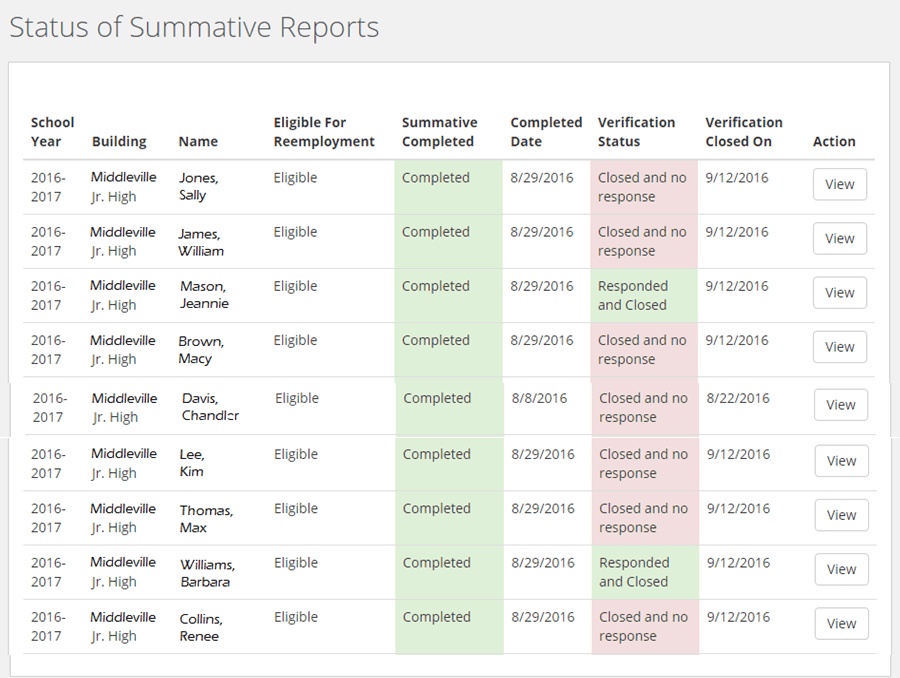
This report gives you a quick view of the summative process across your entire faculty. Whose summative have you completed, and whose still needs your attention? Who has viewed and responded to the summative? Quickly see the entire summative process for each teacher in one report to help you stay on track and get it all accomplished at a time of year that is exceedingly busy.
Read more about NEE’s teacher summative evaluation process in our Summative Evaluation blog topic.
Feature 4: EdHub
Integrated in the NEE Data Tool is our professional learning resource library, EdHub. It houses over 500 resources for educators to access for growth and development. The materials are written at the University of Missouri College of Education & Human Development, and we regularly update and add to the materials to align with best practices and new research.
Materials are organized by indicator and by topic – including classroom management, cognitive engagement, educational leadership, and school culture, just to name a few.
A particularly helpful resource for administrators is the Indicator Scoring Practice Videos and the Indicator Video Exemplars. Scoring practice videos can be used to improve scoring consistency among the administrative team in the building and district and for individual practice if you’re struggling to score a specific indicator. The video exemplars are great resources for better understanding what sets great teaching apart on specific indicators.
All teachers with a login to the NEE Data Tool can access EdHub. The modules can all be completed at a teacher’s own pace.
EdHub enhances an administrator’s ability to coach teachers by pointing them toward resources that can help them develop in very specific areas. The materials can be used with individuals, small groups, or as presentations for the whole faculty.
There’s a lot to explore in EdHub, so if you have a NEE login, we encourage you to go check it out and use these resources to your advantage.
These four features are just a select few of the many features that will help you improve, simplify, and streamline your evaluation processes. There is so much you can do inside this system and platform. We are just scratching the surface!
Read more about NEE Data Tool features under our NEE Data Tool blog topic.
The Network for Educator Effectiveness (NEE) is a simple yet powerful comprehensive system for educator evaluation that helps educators grow, students learn, and schools improve. Developed by preK-12 practitioners and experts at the University of Missouri, NEE brings together classroom observation, student feedback, teacher curriculum planning, and professional development as measures of effectiveness in a secure online portal designed to promote educator growth and development.